> For the complete documentation index, see [llms.txt](https://docs.xbstation.com/llms.txt). Markdown versions of documentation pages are available by appending `.md` to page URLs; this page is available as [Markdown](https://docs.xbstation.com/xblink-mini/user-manual/xbstationpilotapp/system-monitor.md).
# System Monitor
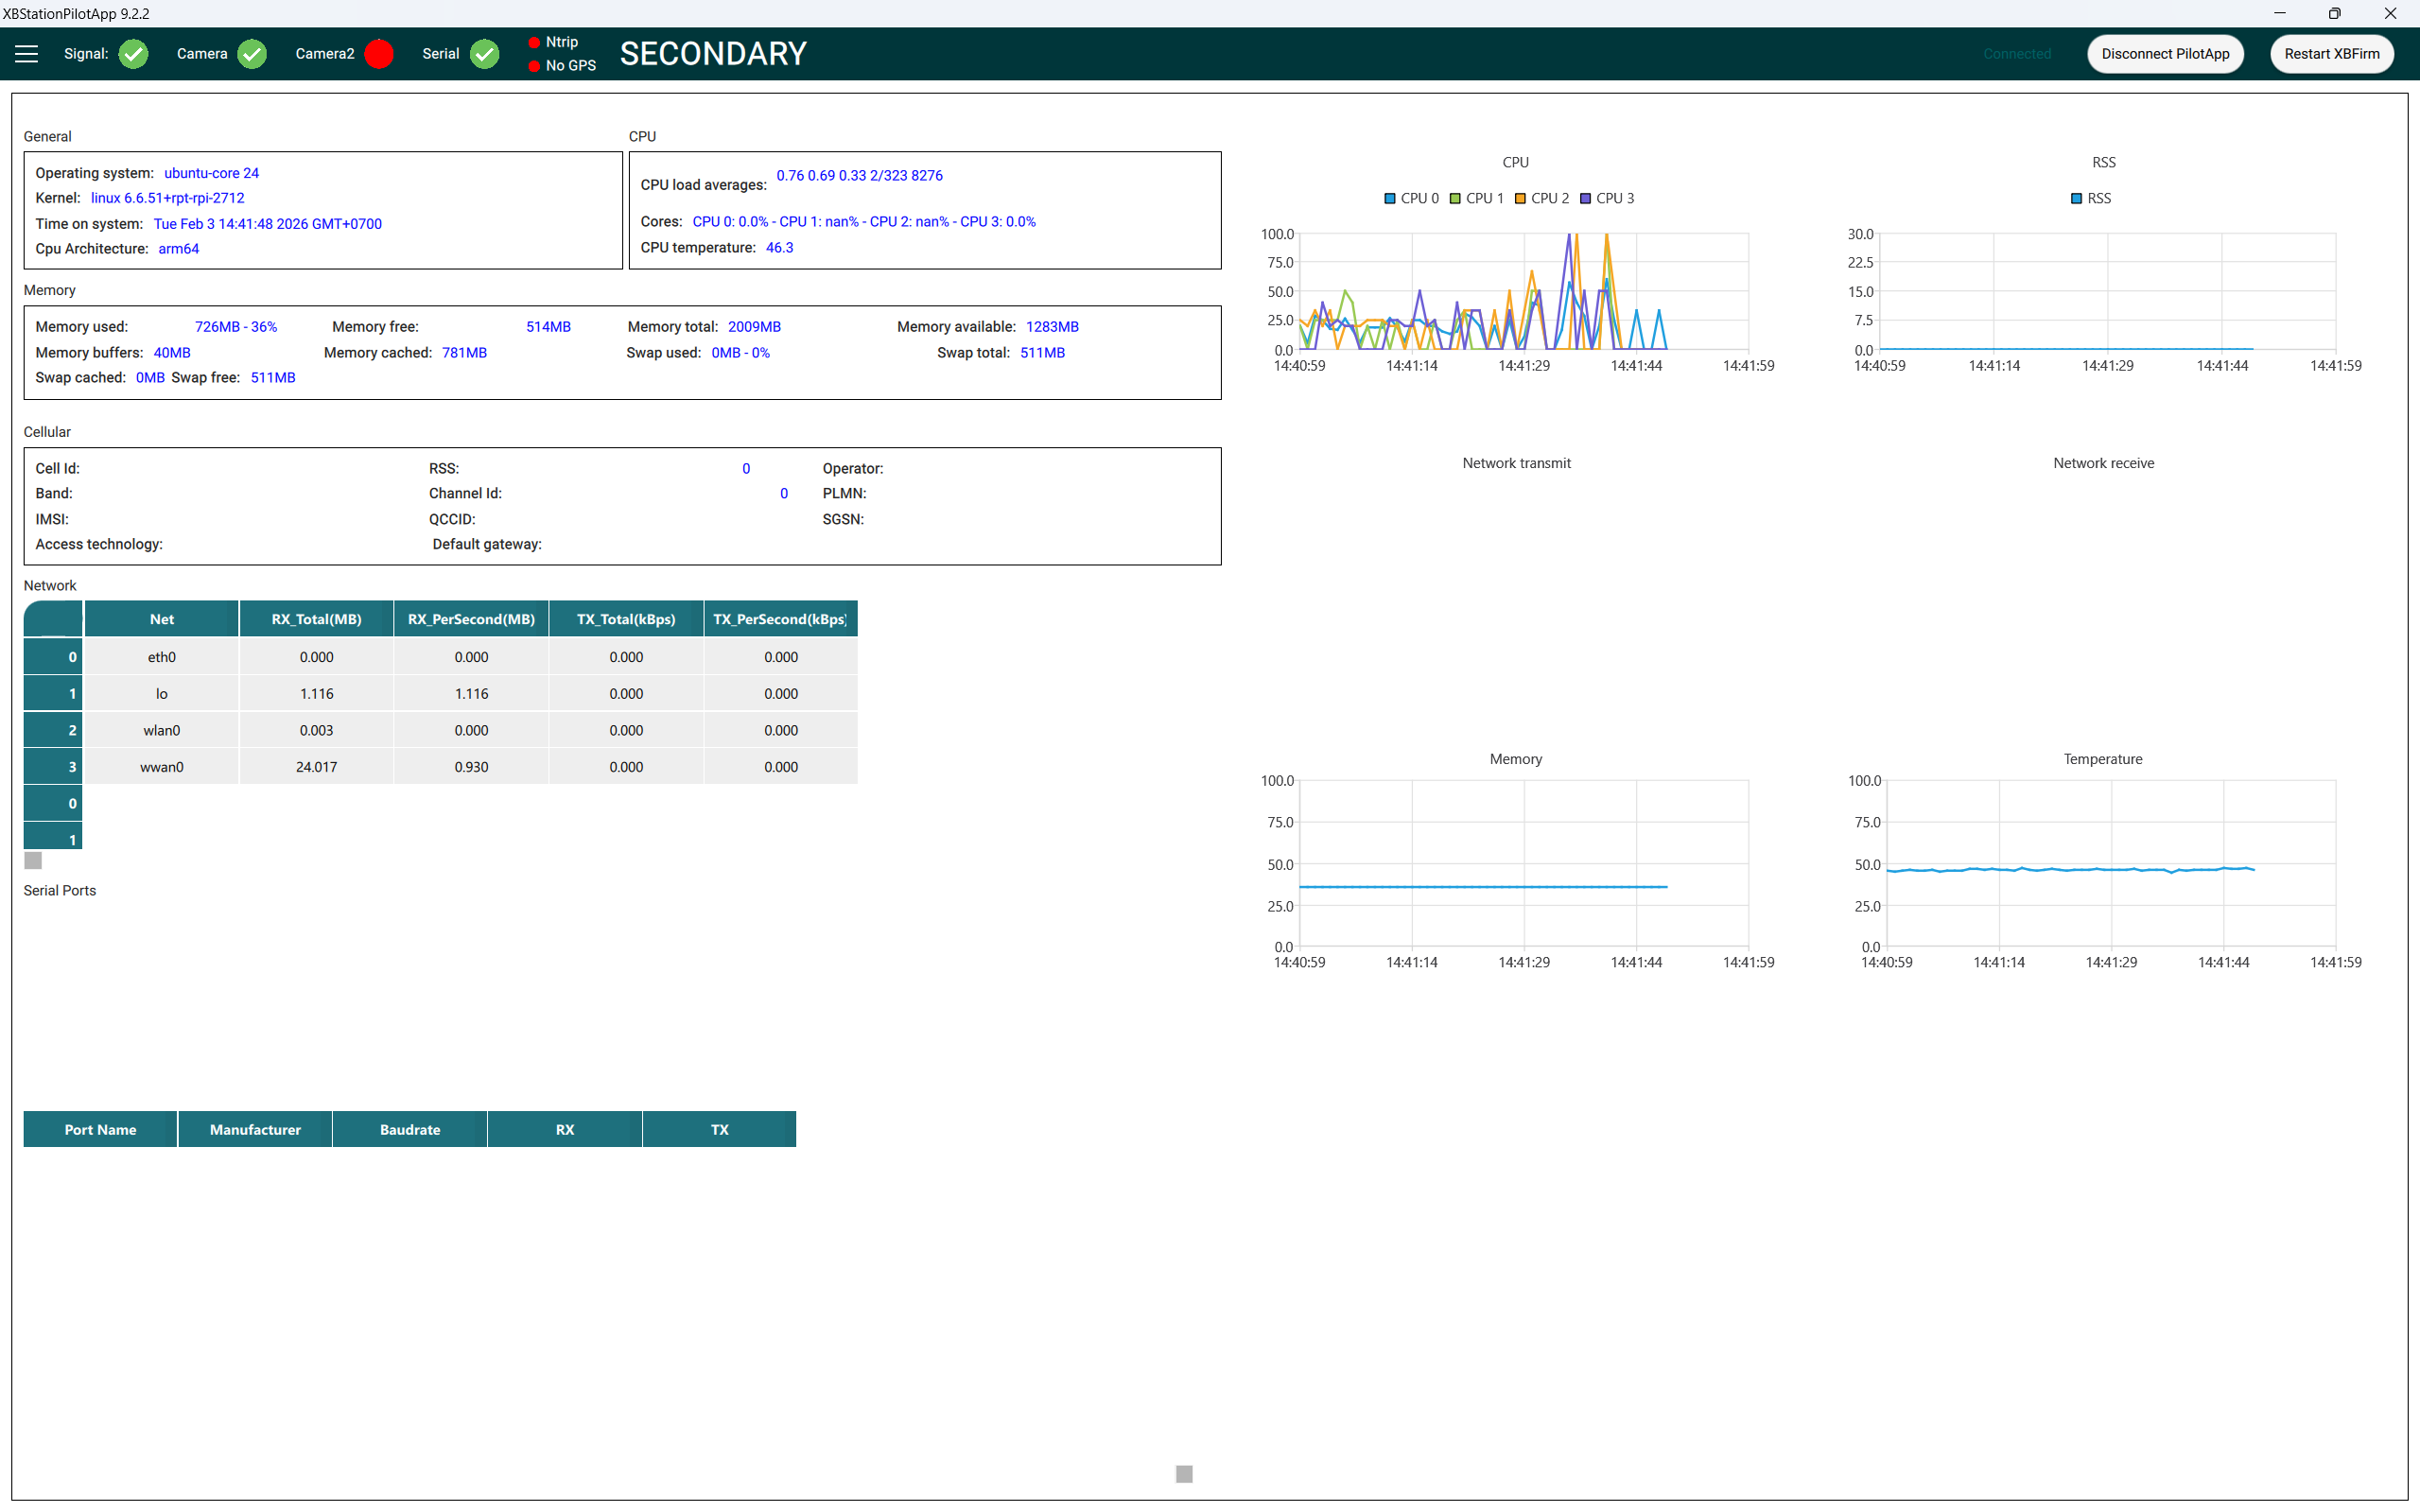
Display XBLink system informations
## Dashboard
 ## System Monitor Tab
 ## Description
* **RSSI**: Received Signal Strength Indicator
**RSSI** (Received Signal Strength Indicator) is a parameter which provides information about total received wide-band power (measure in all symbols) including all interference and thermal noise.
| **Value** | **RSSI dBm** | **Condition** |
| --------- | ------------ | ------------- |
| 2 | -109 | Marginal |
| 3 | -107 | Marginal |
| 4 | -105 | Marginal |
| 5 | -103 | Marginal |
| 6 | -101 | Marginal |
| 7 | -99 | Marginal |
| 8 | -97 | Marginal |
| 9 | -95 | Marginal |
| 10 | -93 | OK |
| 11 | -91 | OK |
| 12 | -89 | OK |
| 13 | -87 | OK |
| 14 | -85 | OK |
| 15 | -83 | Good |
| 16 | -81 | Good |
| 17 | -79 | Good |
| 18 | -77 | Good |
| 19 | -75 | Good |
| 20 | -73 | Excellent |
| 21 | -71 | Excellent |
| 22 | -69 | Excellent |
| 23 | -67 | Excellent |
| 24 | -65 | Excellent |
| 25 | -63 | Excellent |
| 26 | -61 | Excellent |
| 27 | -59 | Excellent |
| 28 | -57 | Excellent |
| 29 | -55 | Excellent |
| 30 | -53 | Excellent |
* **Access Technology**: Radio Access Technology being used by XBLink Mini
* **PC Ping:** Ping time from pilot app to streaming server
* **XBLink Ping**: Ping time from XBLink Mini to streaming server
* **Cloud:** Streaming Server domain, (Ex: hk stand for HongKong)
* **CPU:** XBLink Mini's CPU performance
* **Memory:** XBLink Mini's Memory performance
* **Temperature:** XBLink Mini's temperature
* **Bytes sent**: Total bytes sent from XBLink Mini
## Description
* **RSSI**: Received Signal Strength Indicator
**RSSI** (Received Signal Strength Indicator) is a parameter which provides information about total received wide-band power (measure in all symbols) including all interference and thermal noise.
| **Value** | **RSSI dBm** | **Condition** |
| --------- | ------------ | ------------- |
| 2 | -109 | Marginal |
| 3 | -107 | Marginal |
| 4 | -105 | Marginal |
| 5 | -103 | Marginal |
| 6 | -101 | Marginal |
| 7 | -99 | Marginal |
| 8 | -97 | Marginal |
| 9 | -95 | Marginal |
| 10 | -93 | OK |
| 11 | -91 | OK |
| 12 | -89 | OK |
| 13 | -87 | OK |
| 14 | -85 | OK |
| 15 | -83 | Good |
| 16 | -81 | Good |
| 17 | -79 | Good |
| 18 | -77 | Good |
| 19 | -75 | Good |
| 20 | -73 | Excellent |
| 21 | -71 | Excellent |
| 22 | -69 | Excellent |
| 23 | -67 | Excellent |
| 24 | -65 | Excellent |
| 25 | -63 | Excellent |
| 26 | -61 | Excellent |
| 27 | -59 | Excellent |
| 28 | -57 | Excellent |
| 29 | -55 | Excellent |
| 30 | -53 | Excellent |
* **Access Technology**: Radio Access Technology being used by XBLink Mini
* **PC Ping:** Ping time from pilot app to streaming server
* **XBLink Ping**: Ping time from XBLink Mini to streaming server
* **Cloud:** Streaming Server domain, (Ex: hk stand for HongKong)
* **CPU:** XBLink Mini's CPU performance
* **Memory:** XBLink Mini's Memory performance
* **Temperature:** XBLink Mini's temperature
* **Bytes sent**: Total bytes sent from XBLink Mini